Explaining the Performance analysis to you is a difficult task .Most of the time the data is presented in graphical presentation , so we can see some sample types of presentation .After reading this, please go through the practice test .
(Samples are not related to the exams marks, but in exam , you can expect the same type with students group performance)
Click here Read more interesting case study based article on each TLS sub topic in my second website
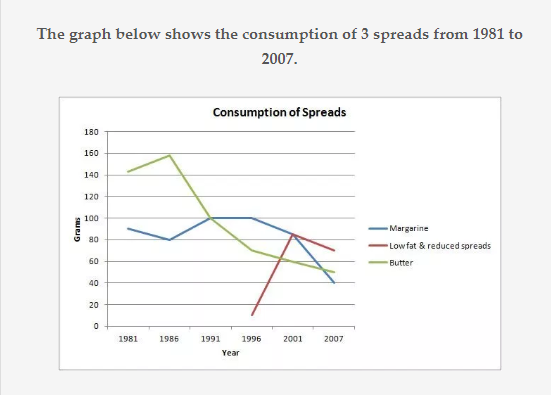
Line Chart
The line chart is nothing but an upgraded version of a bar chart. It is formed by connecting the uppermost point of the bars so that we have a line. By repeating this following process, with other bars as well we will get a line chart. The calculations can be tough but the main aim of the examiner is to check whether you can apply logic to eliminate options and evaluate the graph thereby getting the answer.
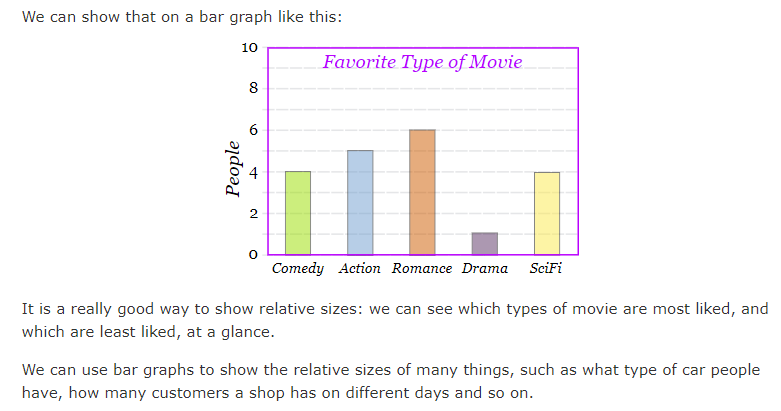
Bar Graph
A bar chart or bar graph is a chart or graph that presents categorical data with rectangular bars with heights or lengths proportional to the values that they represent. The bars can be plotted vertically or horizontally. A vertical bar chart is sometimes called a column chart.
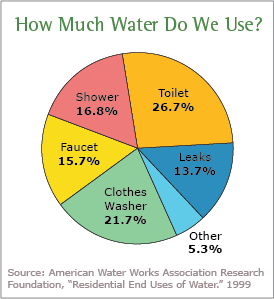
Pie chart
A pie chart is a circular statistical graphic, which is divided into slices to illustrate numerical proportion. In a pie chart, the arc length of each slice, is proportional to the quantity it represents
What is a Pie Chart?
A Pie Chart is a type of graph that displays data in a circular graph. The pieces of the graph are proportional to the fraction of the whole in each category. In other words, each slice of the pie is relative to the size of that category in the group as a whole. The entire “pie” represents 100 percent of a whole, while the pie “slices” represent portions of the whole.
The following chart shows water usage (image courtesy of the EPA). You can see that toilet water usage is greater than shower water usage because the piece of the “pie” is greater:
Practice Questions
Q. In the following graph, the increase in the wheat over years is shown. Based on this answer the questions below.

1. How much does the wheat grow in 1994 as compared to the previous year?
A. 12.2% B. 13.6%
C. 16.1% D. 17.8%
Ans: The correct answer is C.
Q. What was an increase in the average rate of growth of wheat from 1993 to 1995?
A. 13% B. 12%
C. 14% D. 16%
Ans: The correct answer is D.
Q. How much percentage of growth of wheat was less in 1994 as compared to 1993?
A. 13.9% B. 12.2%
C. 11.9% D. 14.6%
Ans: The correct answer is A.
Q. What was the average of the total wheat, grew from 1995 to 1997?
A. 22 tonnes B. 26 tonnes
C. 28 tonnes D. 25 tonnes
Ans: The correct answer is B.
Practice Questions
In the given figure number of laptops prepared by two different companies is given from 2004 to 2009. Answer the questions based on the figure below.

Q. What will be the difference in the number of laptops made by the company X in the year 2004 and 2005?
A. 10000 B. 20000
C. 30000 D. 40000
The correct answer is B.
Q. The production of the laptop by the company Y was how much percentage of the production by company X in the year 2007?
A. 120 B. 148
C. 152 D. 164
The correct answer is D.
Q. For all the given years in the figure, what is the total number of laptops made by both the companies?
A. 144000 B. 145000
C. 145800 D. 146200
The correct answer is C.
Q. What was the maximum difference between the manufacturing of laptop by both the companies?
A. 40000 B. 41000
C. 45000 D. 51000
The correct answer is D.